



 Home
Home

From complex additive manufacturing process data to actionable quality insights, AMM makes every build traceable and every improvement data-driven.
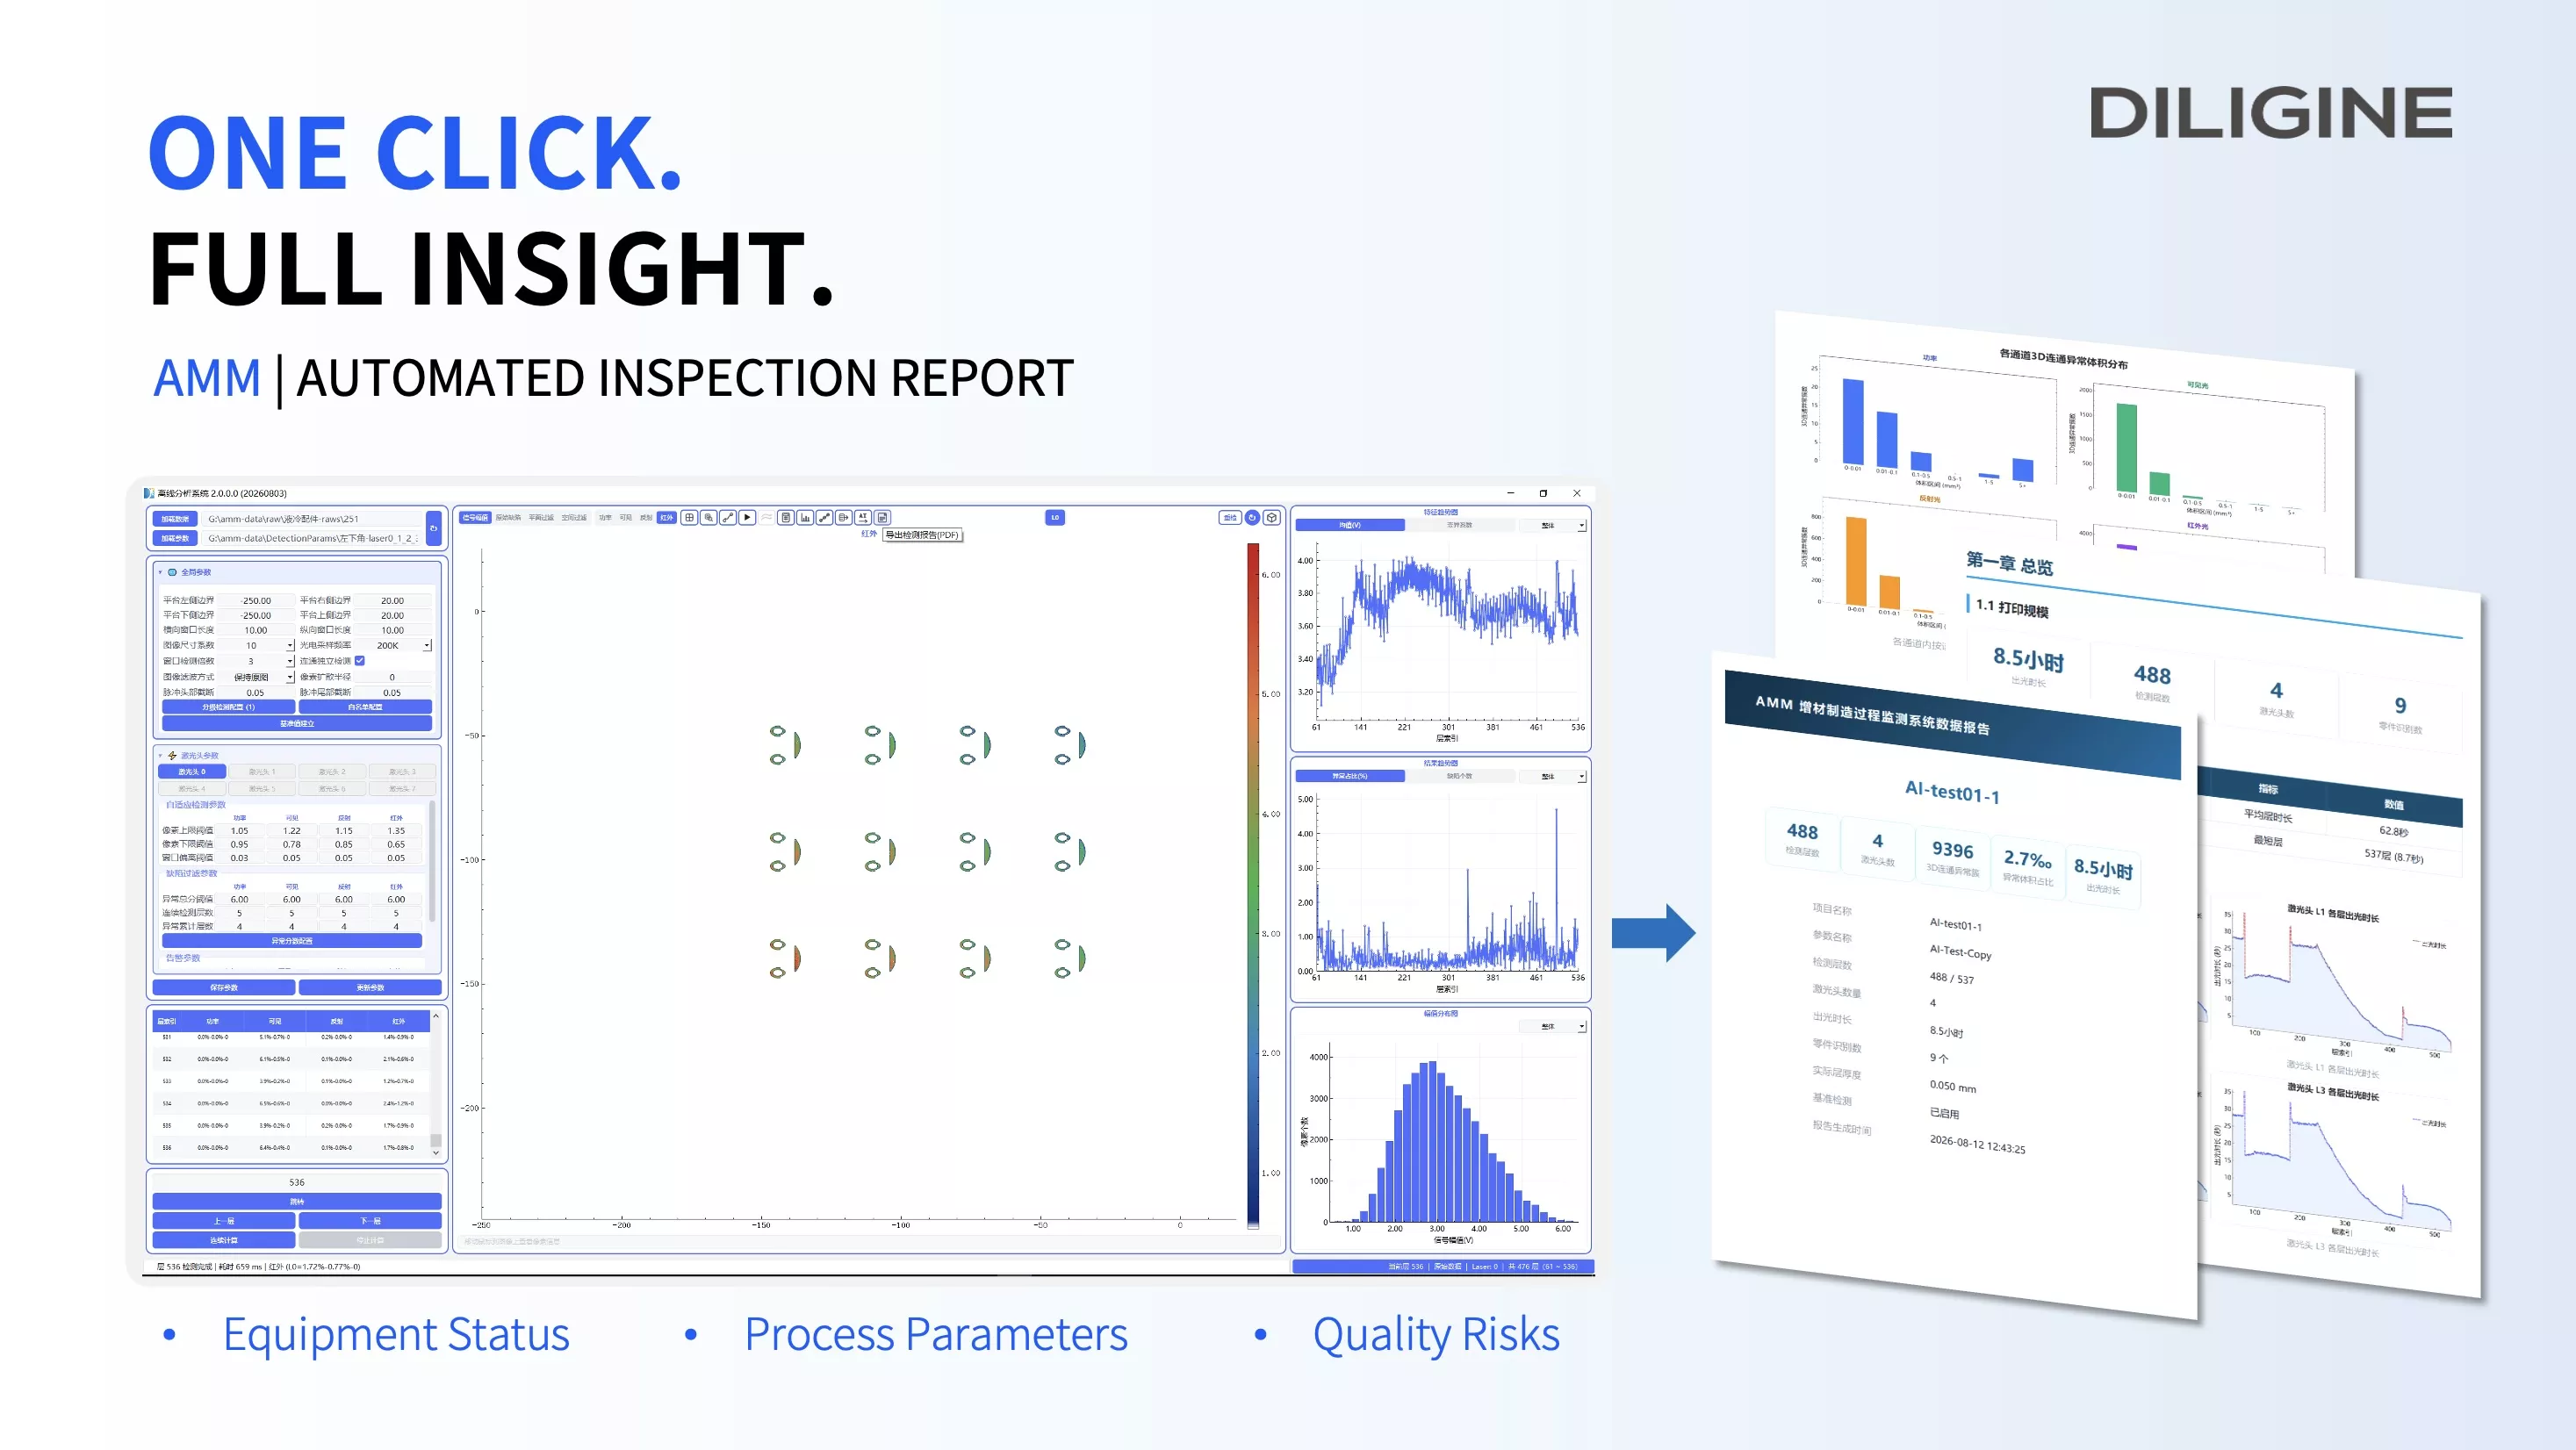
Completing a metal additive manufacturing build is only the beginning of quality evaluation.
A single build can generate large volumes of monitoring data across hundreds of layers, multiple laser heads, multiple parts and several optical signal channels. Turning all this data into clear, actionable information has traditionally required time-consuming manual consolidation and analysis.
DILIGINE's Additive Manufacturing Monitoring system, AMM, now introduces a new automated reporting feature designed to simplify this process.
During printing, AMM continuously captures multichannel signals, including laser power, visible light, reflected light, and infrared light. It maps these time-domain signals to scan paths, build layers, and part locations.
Once printing and data analysis are complete, users can generate a structured PDF report with one click. Covering three core dimensions and more than ten detailed insights, the report turns complex process data into clear, traceable quality information without the need to export data, organize charts, or compile reports manually.
Three Dimensions of Build Quality Insight
1. Equipment Status: Identify Performance Differences and Potential Instability
The AMM report summarizes monitored layers, laser-on time, signal variation, and 3D connected anomalies for each laser head. It also provides visual comparisons across multiple laser heads.
By reviewing layer-by-layer laser-on time and multichannel coefficients of variation, engineers can identify:
- Performance differences between laser heads
- Signal changes during specific build stages
- Equipment or time periods requiring further investigation
- Potential long-term stability trends
These insights provide a data-based reference for equipment inspection, preventive maintenance, and root-cause analysis.
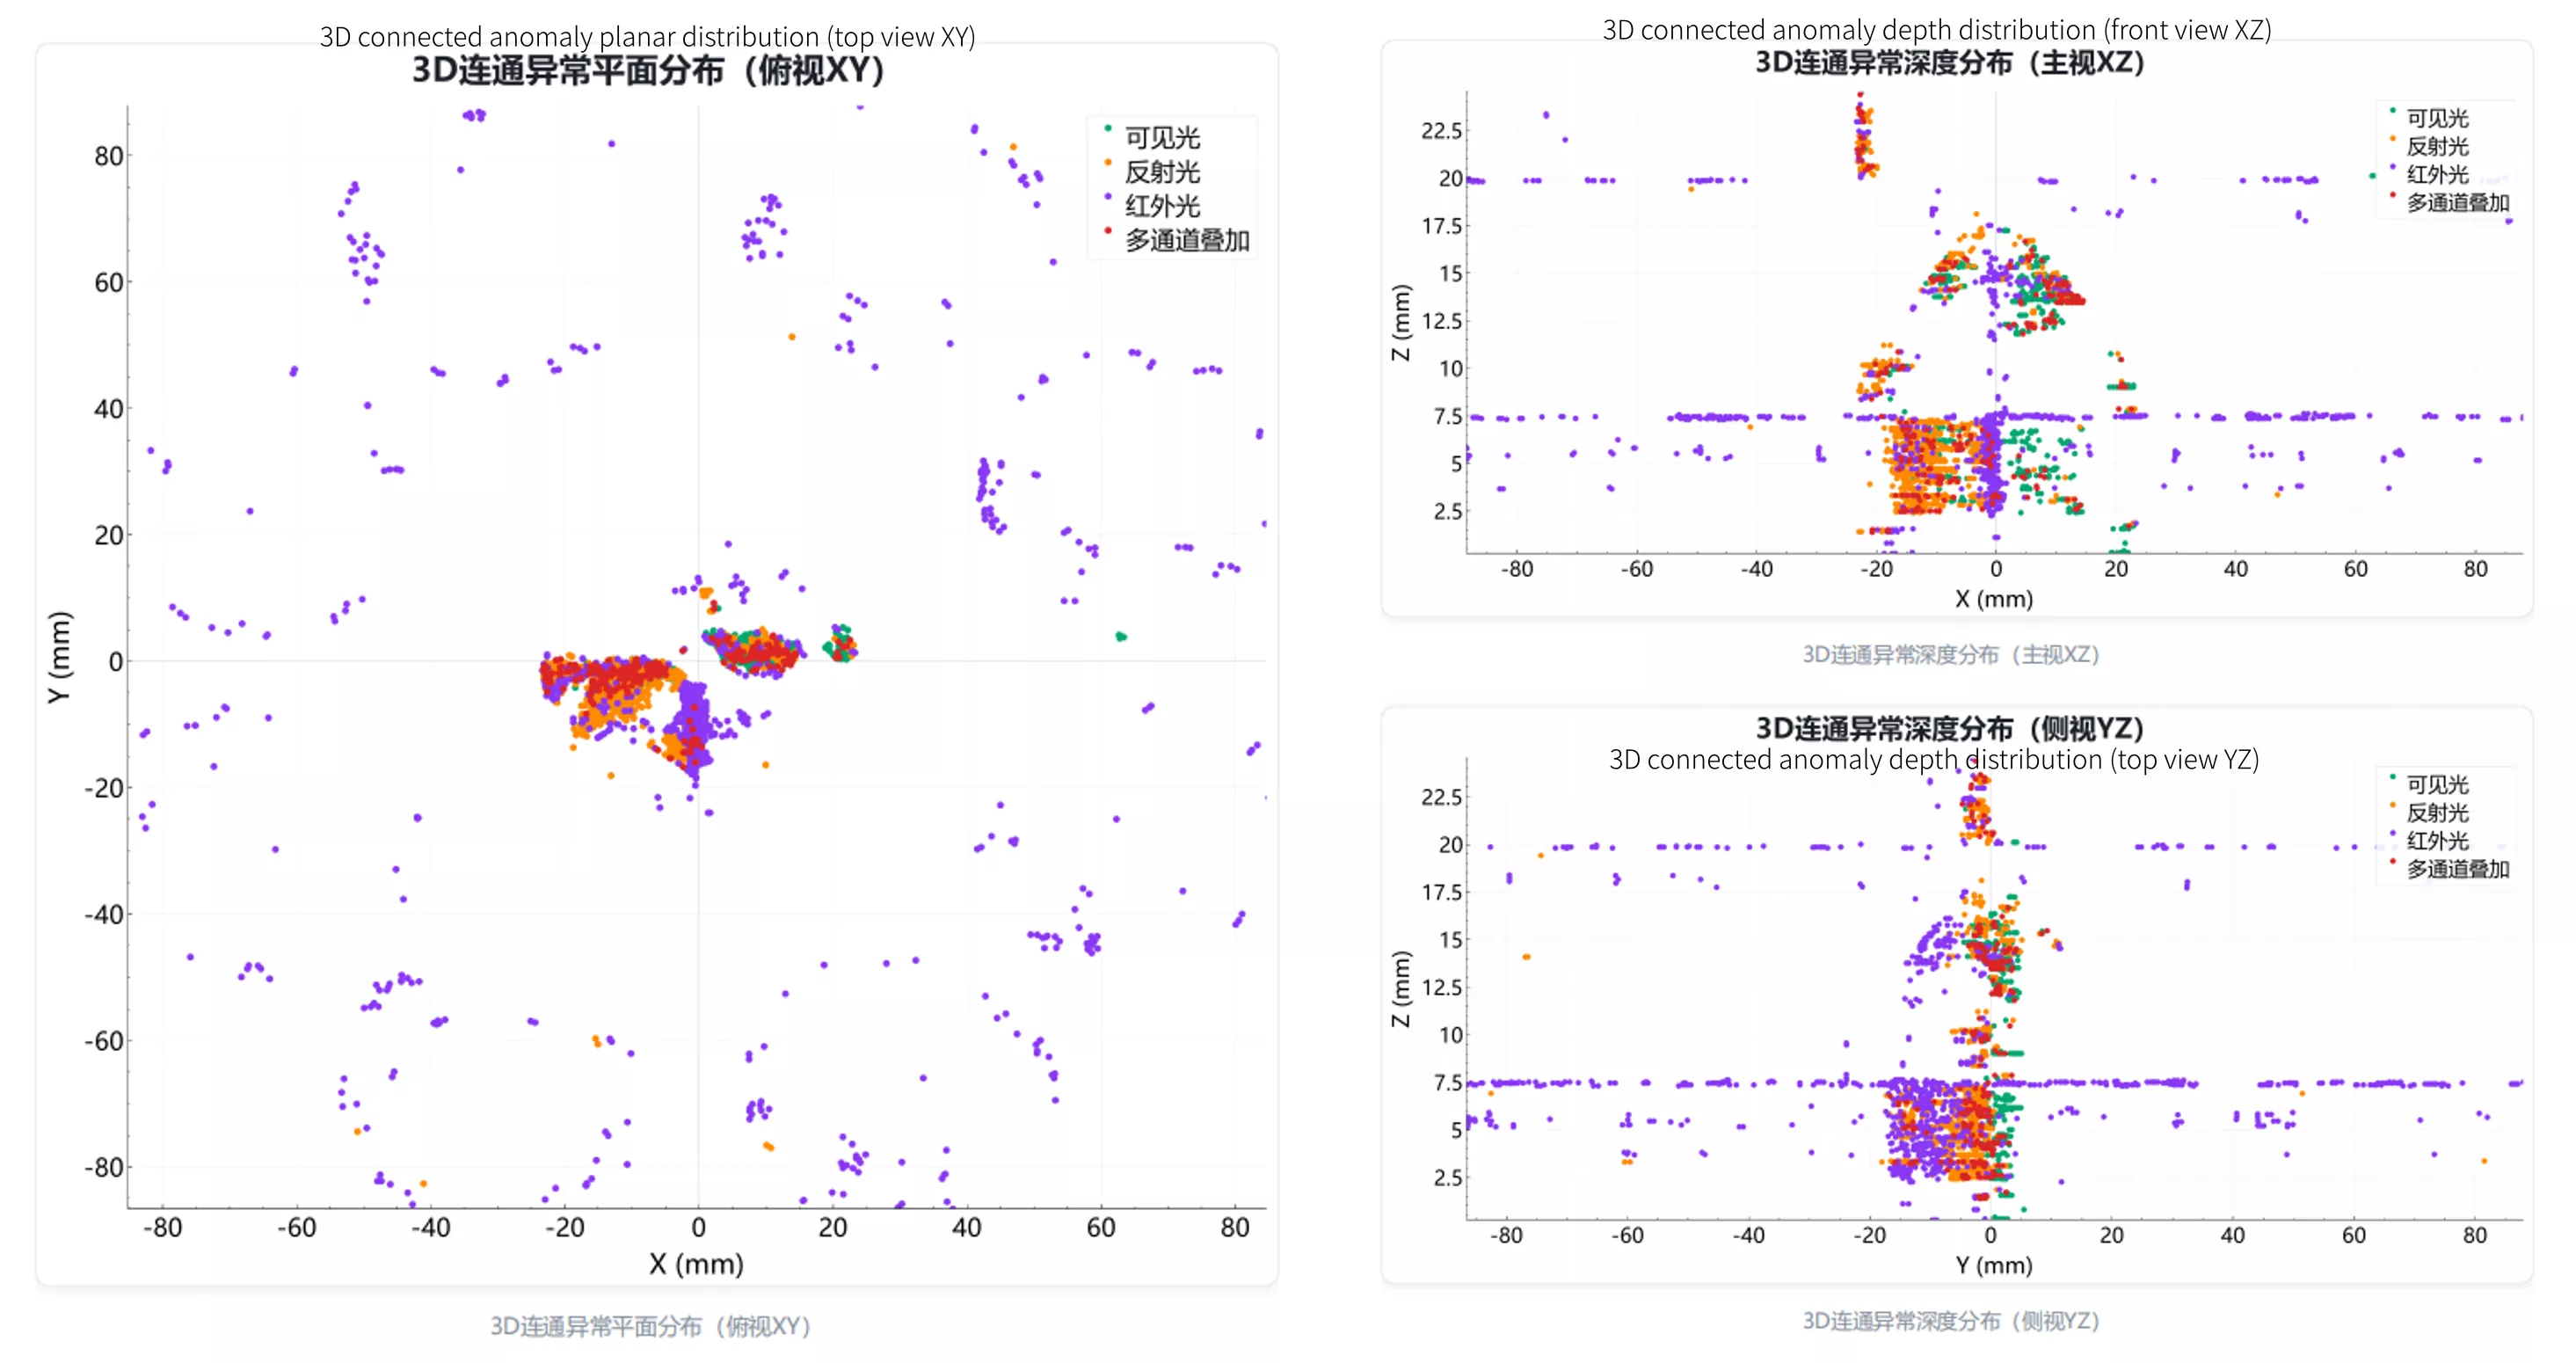
- Report example: Displays defect distribution in different views. The top view clearly shows the defect status of each laser head/part, while the front/side views clearly indicate the distribution along the height direction.
2. Process Stability: Track Changes Layer by Layer
A single signal fluctuation does not necessarily indicate a quality issue. Meaningful process evaluation requires signals to be analyzed in relation to build layers, laser heads, scan regions, and changes across adjacent layers.
AMM visualizes the mean values and trends of four signal channels: power, visible light, reflected light, and infrared light. The coefficient of variation is used to evaluate signal stability across different laser heads and scan-line types.
The report also identifies statistical outlier layers and applies Z-axis filtering to determine whether an anomaly occurs in only one layer or continues across adjacent layers.
This allows engineers to understand:
- When an anomaly first appeared
- Whether it was limited to a single layer
- Whether it developed across multiple adjacent layers
- Whether it was concentrated in a specific scan region or process stage
- Whether signal stability improved after parameter adjustments
Over time, these trend data support process-window optimization and parameter iteration.
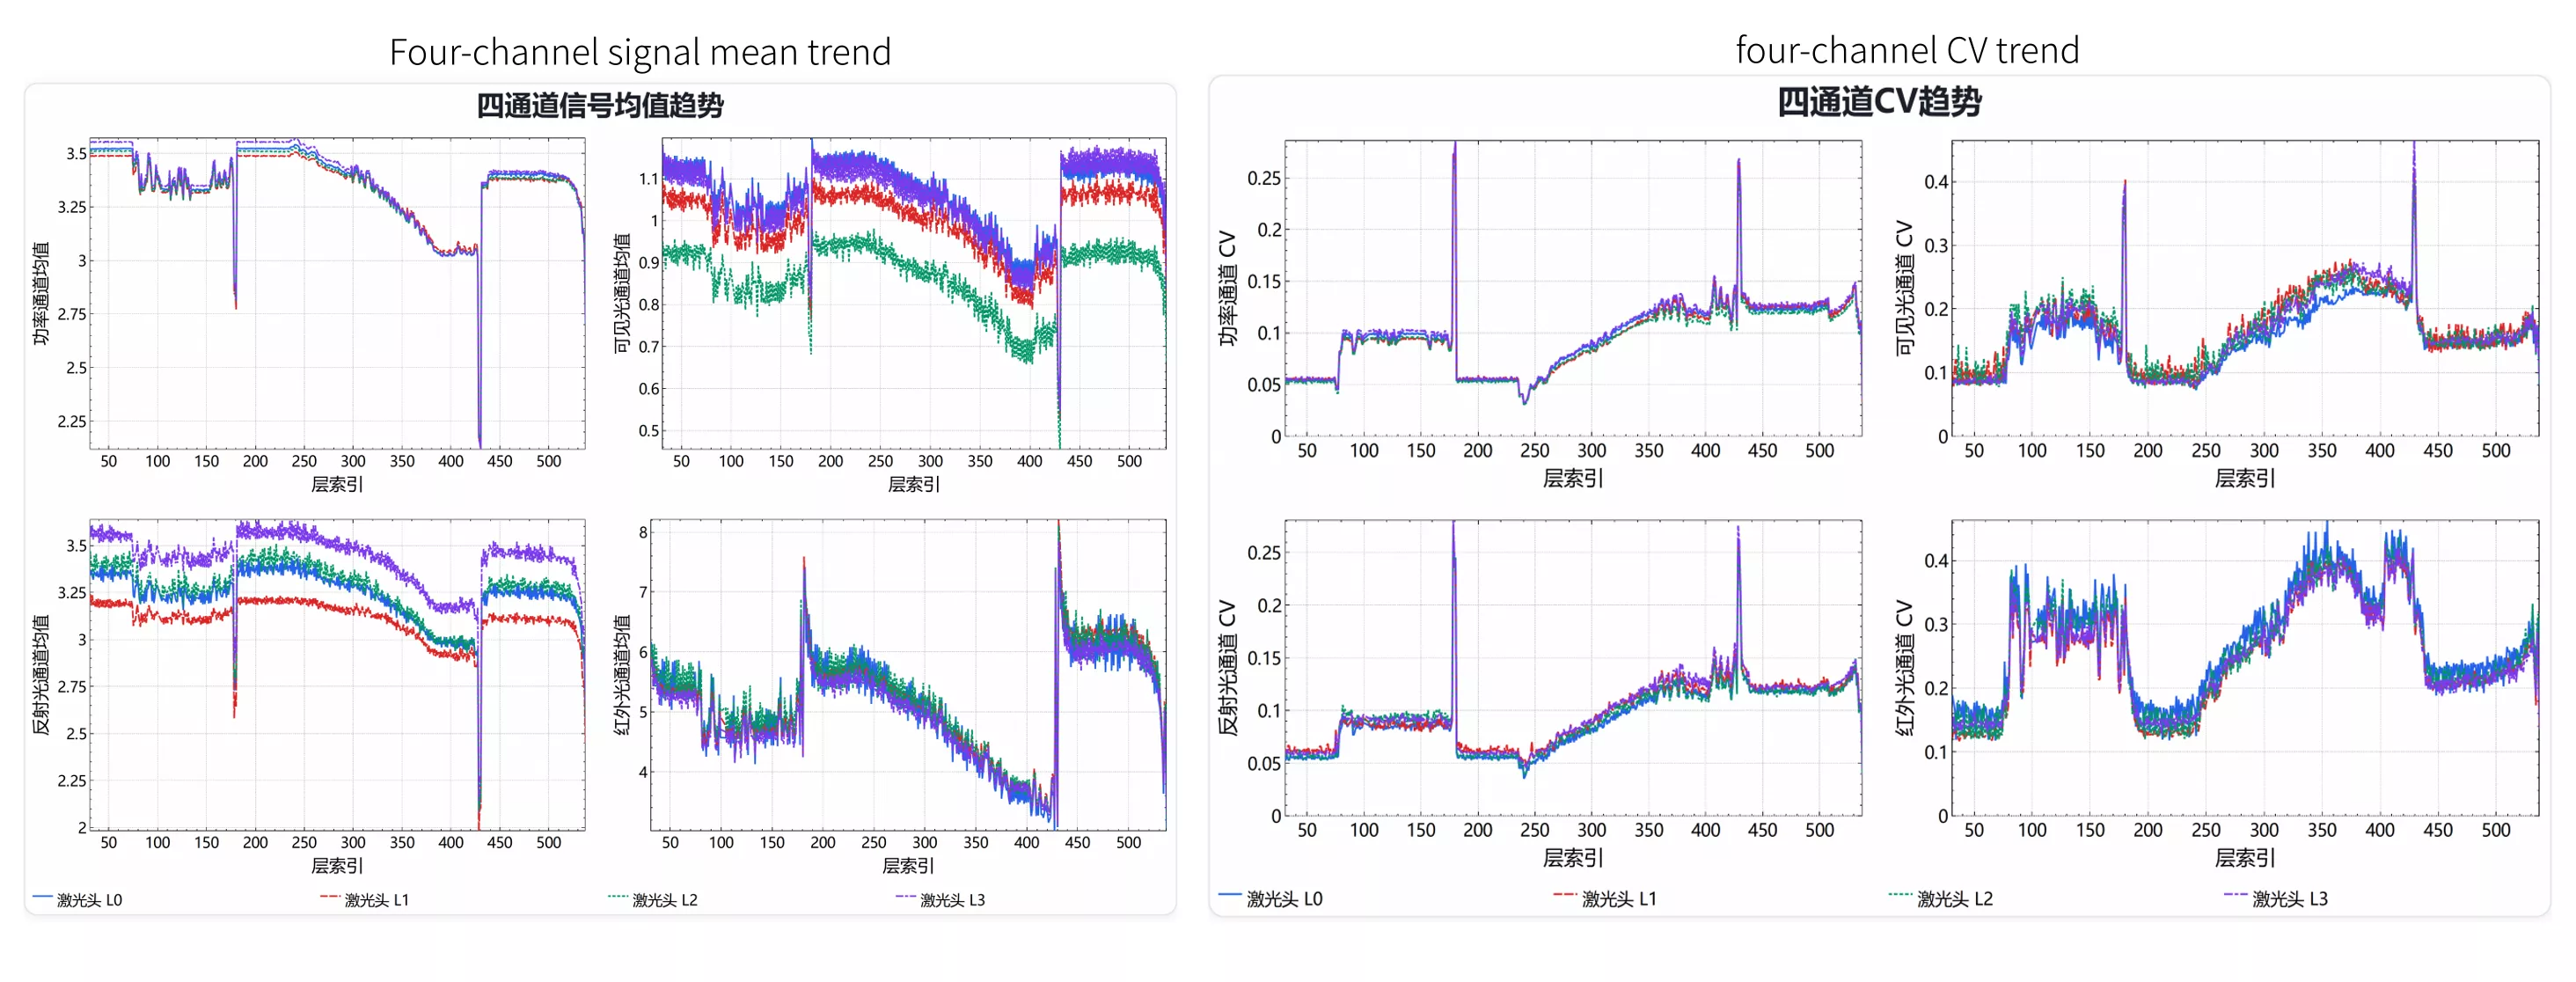
- Report Example: Trends of Mean Values and Coefficient of Variation (CV) for Power, Visible Light, Reflected Light, and Infrared Light Signals
3. Quality Risk: From Anomaly Signals to 3D Spatial Evidence
AMM links anomaly signals to specific parts and their locations in three-dimensional space.
For each part, the report can summarize anomaly count, anomaly volume ratio, maximum anomaly volume, and channel distribution. Spatially connected anomaly points are grouped into 3D connected anomaly clusters.
For each cluster, the report presents:
- Associated part
- Affected layer range
- Anomaly volume
- Spatial geometry
- Participating signal channels
Cross-channel analysis also shows whether the same anomaly region is detected by two or more monitoring channels, providing additional process evidence for engineering assessment.
With XY top views, XZ front views, YZ side views, 3D point clouds, and channel heat-field visualizations, engineers can examine the spatial relationship between anomaly regions and part geometry more intuitively.
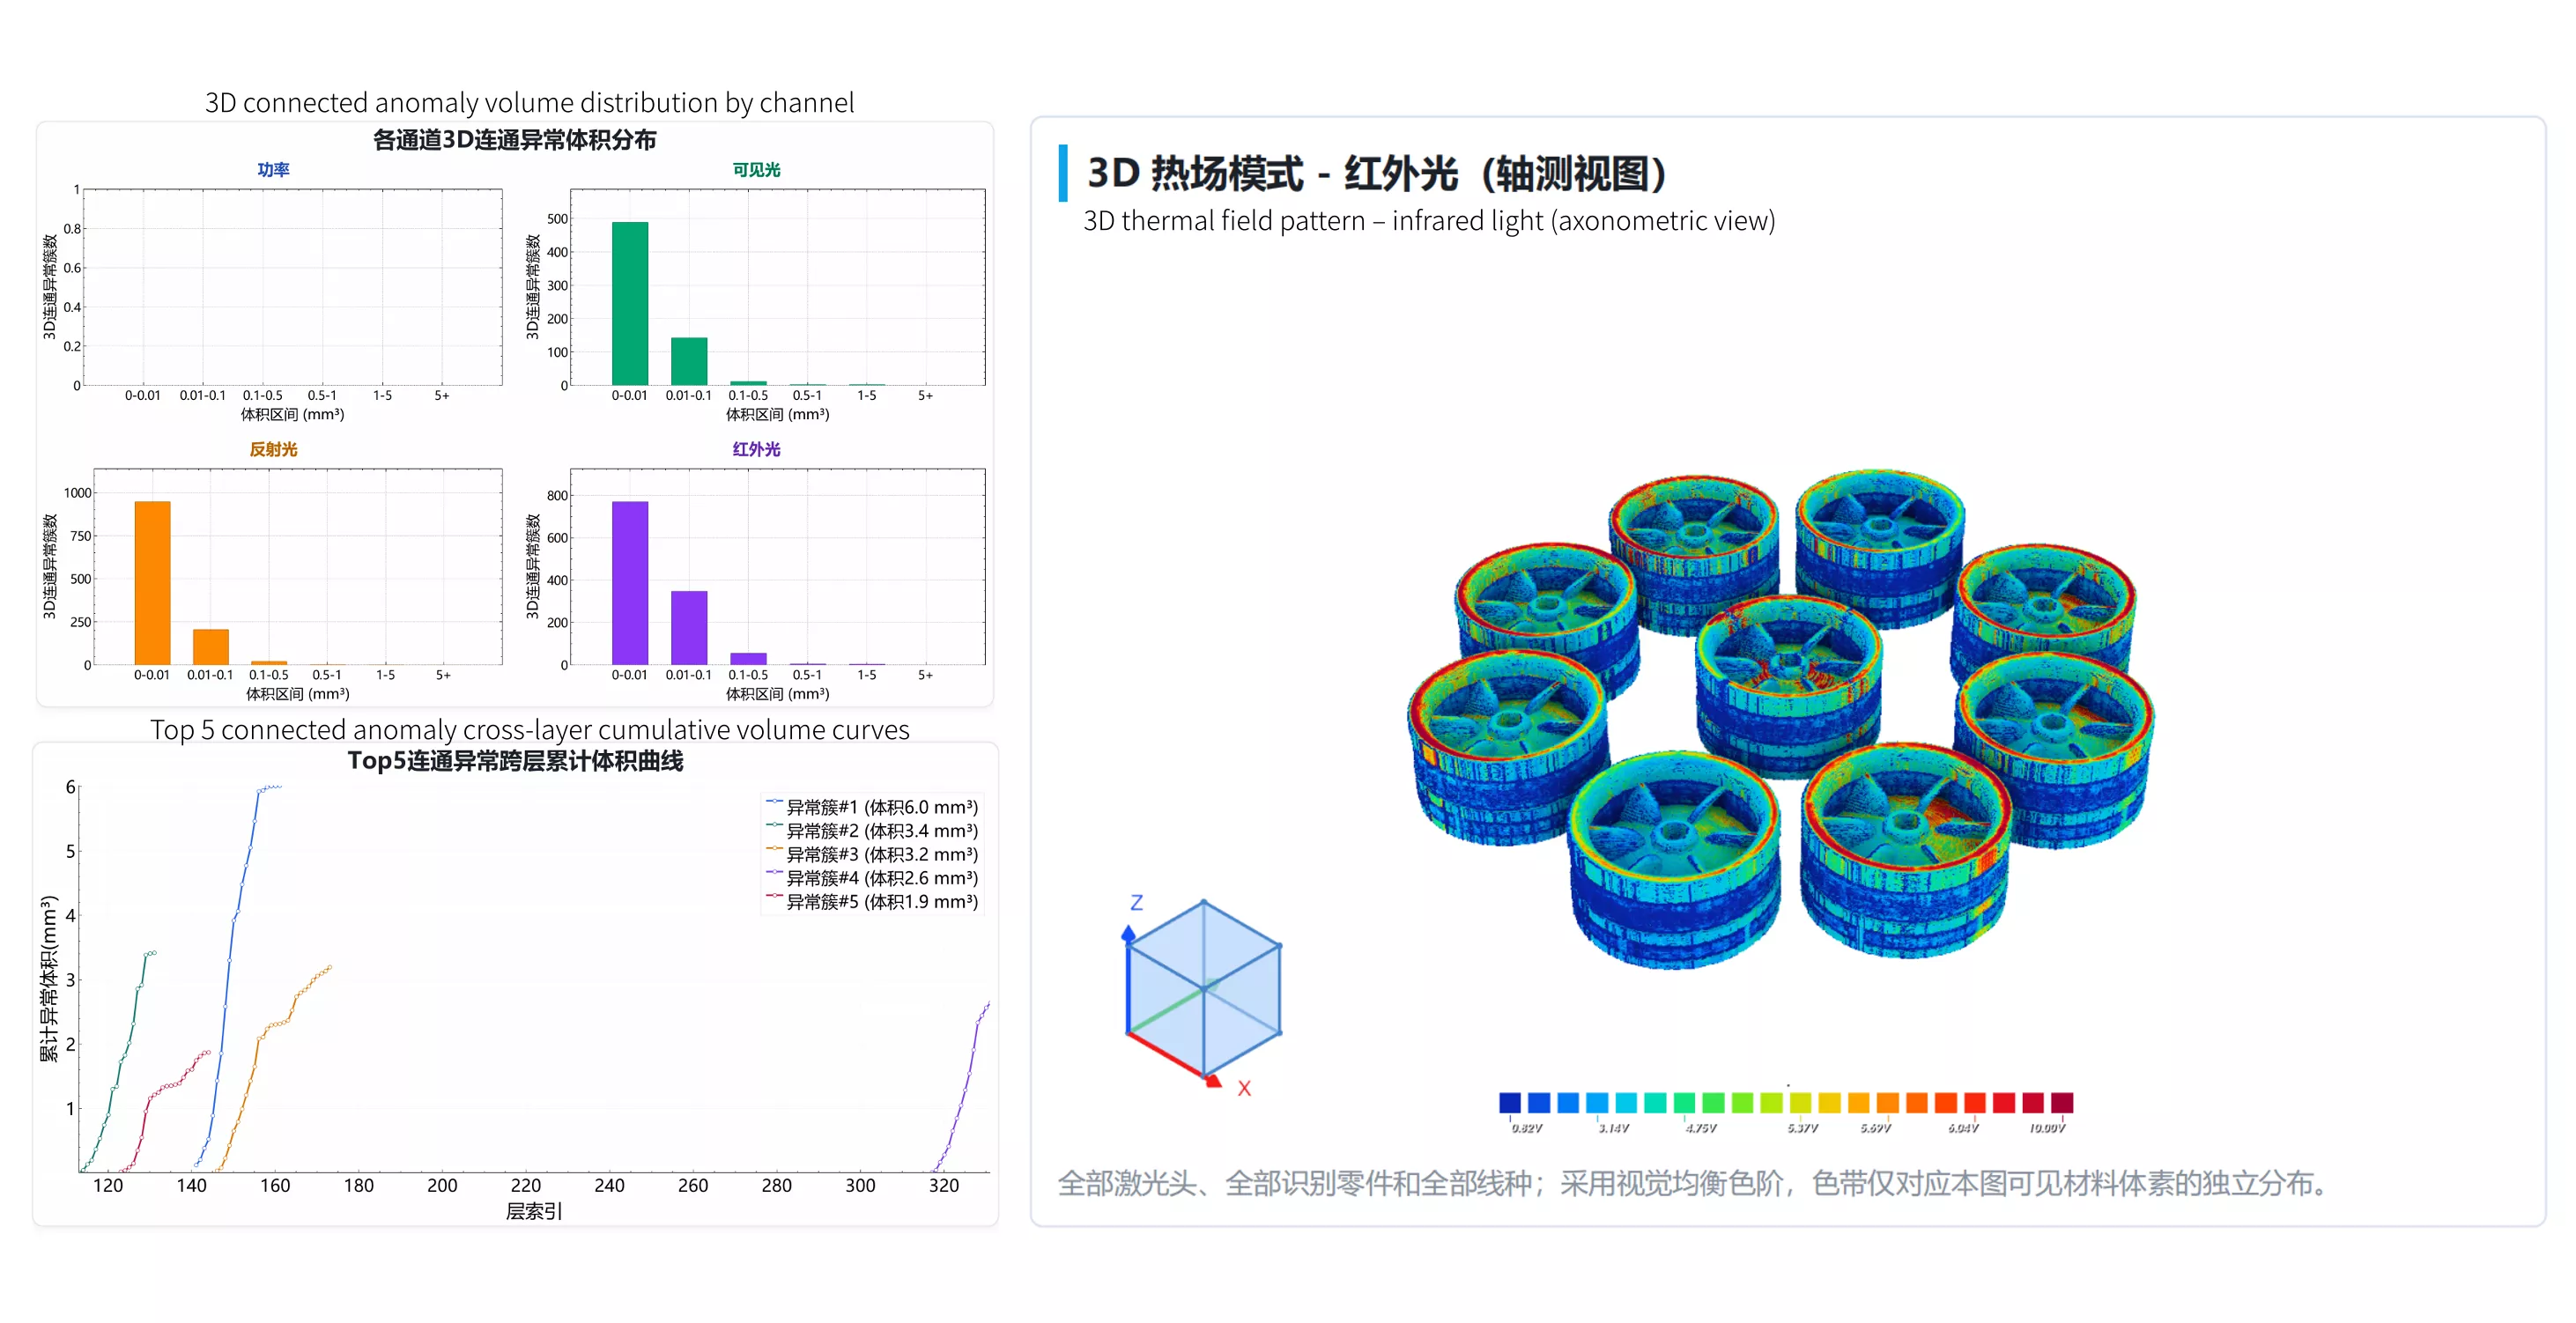
- Report example: Top 5 connected anomaly cross-layer cumulative volume curve (bottom left) shows the propagation of severe defects across printing layers.
Turning Monitoring Data into Continuous Improvement
The value of the AMM automated inspection report lies in converting complex monitoring data into actionable information for quality decisions and continuous improvement.
Report content can be customized to meet different application requirements. As report data accumulates, manufacturers can establish consistent analysis standards, identify recurring variations and long-term drift, evaluate the effectiveness of corrective actions, and continuously improve equipment and process performance.
The function also reduces manual reporting work for production, process, and quality teams, improves cross-functional communication, and provides traceable evidence for anomaly review.
Visit DILIGINE at Formnext to explore the latest AMM capabilities and discover a smarter, more stable, and more traceable approach to additive manufacturing quality control.